
“Government’s Claims vs Official Data”
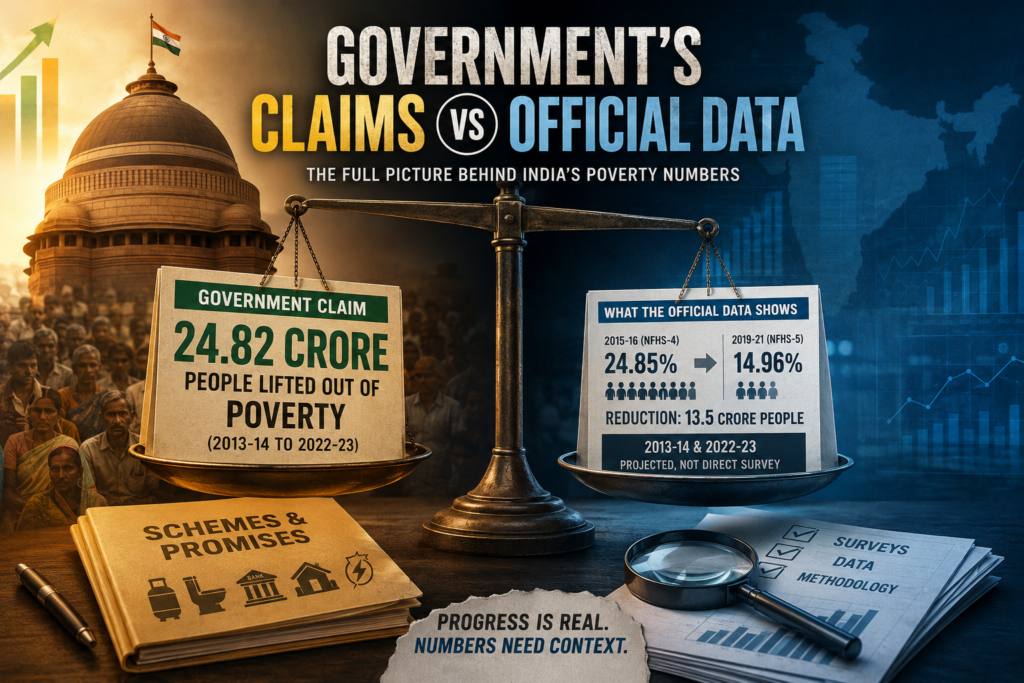
Every few months we hear a big number from the government about how many people have been lifted out of poverty. One of the most repeated ones in recent years is this: nearly 25 crore Indians escaped multidimensional poverty between 2013-14 and 2022-23. That’s the claim that comes straight from NITI Aayog, the government’s own think tank. They put it out in a discussion paper in January 2024, and ministers have repeated it in Parliament since then. The exact figure is 24.82 crore people. Poverty headcount ratio, they say, fell from 29.17 per cent in 2013-14 to 11.28 per cent in 2022-23. That sounds impressive. Almost a quarter of a billion people moving out of poverty in nine years. But when you sit with the actual government data and the method behind the number, the picture gets more careful and less dramatic. The official source is NITI Aayog’s discussion paper titled “Multidimensional Poverty in India since 2005-06.” It builds on the National Multidimensional Poverty Index that the same body released earlier. That index looks at twelve indicators across health, education and standard of living — things like nutrition, years of schooling, access to clean cooking fuel, sanitation, electricity, bank accounts and so on. It is not a pure income measure. It is a deprivation score. The solid survey data comes from the National Family Health Survey. NFHS-4 (2015-16) put the multidimensional poverty rate at 24.85 per cent. NFHS-5 (2019-21) brought it down to 14.96 per cent. That five-year gap accounts for about 13.5 crore people moving out of the category. Those two survey points are real, large-scale household data collected by the Ministry of Health and Family Welfare and analysed by NITI Aayog. No one seriously disputes that the indicators improved in that period — more toilets, more bank accounts, better access to electricity and cooking gas in many places. The bigger 24.82 crore claim stretches beyond those survey years. For 2013-14 (just before the current government took office) and for 2022-23 (after the last full NFHS), NITI Aayog used projections. They took the rate of decline observed between earlier surveys and applied it forward and backward. The paper itself says the 2013-14 and 2022-23 figures are interpolated and extrapolated. In plain language, they are estimates based on trends, not fresh survey counts for those exact years. Population numbers also had to be projected because India did not have a new census after 2011. So the government’s own numbers show two layers. The measured improvement between 2015-16 and 2019-21 is clear and substantial — 13.5 crore people. The larger claim that reaches back to 2013-14 and forward to 2022-23 rests on the assumption that the same pace of improvement continued steadily. That assumption may be reasonable, but it is still an assumption. The discussion paper notes technical inputs from UNDP and the Oxford Poverty and Human Development Initiative, which gives it international methodological backing. Still, it remains a modelled figure rather than a direct headcount from a nationwide survey for the full nine-year span. When the same claim is repeated in Parliament or in official statements, the distinction between measured and projected sometimes gets blurred. The press release from PIB on 15 January 2024 and later replies in Lok Sabha present the 24.82 crore figure as the outcome of government schemes. The schemes are real — Swachh Bharat, Ujjwala, Jan Dhan, housing and electricity programmes did expand access to several of the indicators that the MPI tracks. Bank accounts and toilets, in particular, moved very fast. Those improvements show up in the NFHS data. Yet the absolute number of people “lifted out” depends heavily on how you define the starting and ending points and how you fill the years without fresh surveys. Another official layer comes from the World Bank’s extreme poverty estimates, which use a different yardstick (income or consumption). Those numbers also show a sharp fall, but they are not the same as the multidimensional measure NITI Aayog uses. Mixing the two creates confusion. The government sometimes cites both, which is fair only if the difference is kept clear. None of this means the progress is imaginary. Household access to basic services has improved for large numbers of people. The NFHS numbers are government data, collected through standard survey methods, and they document real gains. The problem is the leap from those measured gains to the rounded, headline-ready claim of nearly 25 crore people over nine years. When the starting year and ending year both rely on projections, the final figure becomes softer than it sounds in speeches. For anyone who wants to check the primary sources, the NITI Aayog discussion paper, the National MPI Progress Review 2023, the relevant PIB releases, and the parliamentary replies by the Minister of State for Planning are all available on official websites. The NFHS reports themselves sit with the Ministry of Health. Reading them side by side shows both the genuine movement on several indicators and the modelling steps that turn those movements into the larger claim. In short, the government’s own data supports a clear reduction in multidimensional deprivation between the two full NFHS rounds. The more ambitious 24.82 crore figure for the longer period is an official estimate built on trends rather than a complete new survey. That distinction matters if we want the numbers to stay honest. @Rohit Manral